|
Below are two infographics for the month of January showing, first, HAWC's Call Center Data such as the number of incoming calls per day, length of call, reason for call, etc., and, second, Assessments and Referrals for individuals and families contacting the Call Center for assistance. [Please note the second image reflects data for January 2024 not January 2023.] To see HAWC's Call Center Data by the month you can click here. 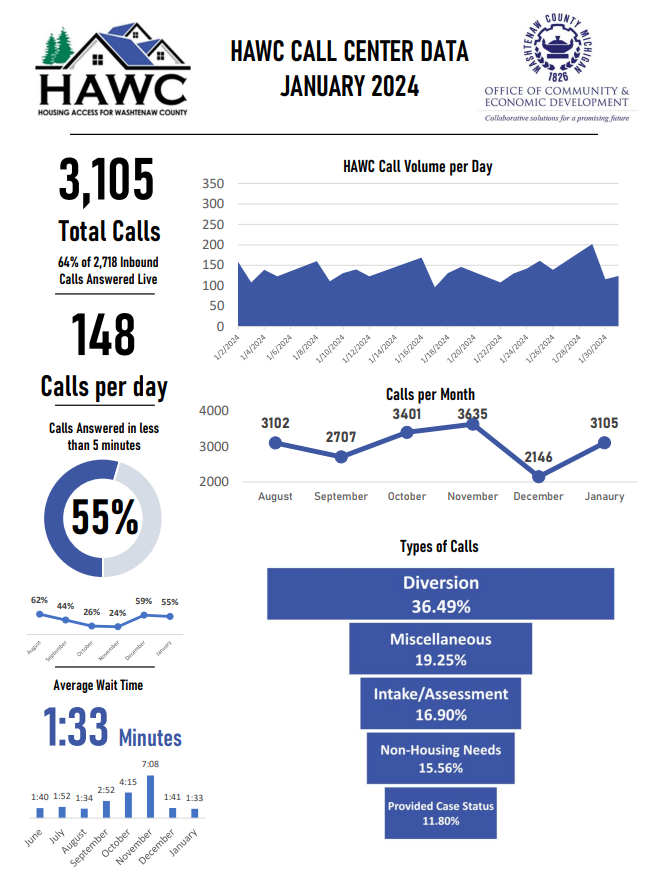 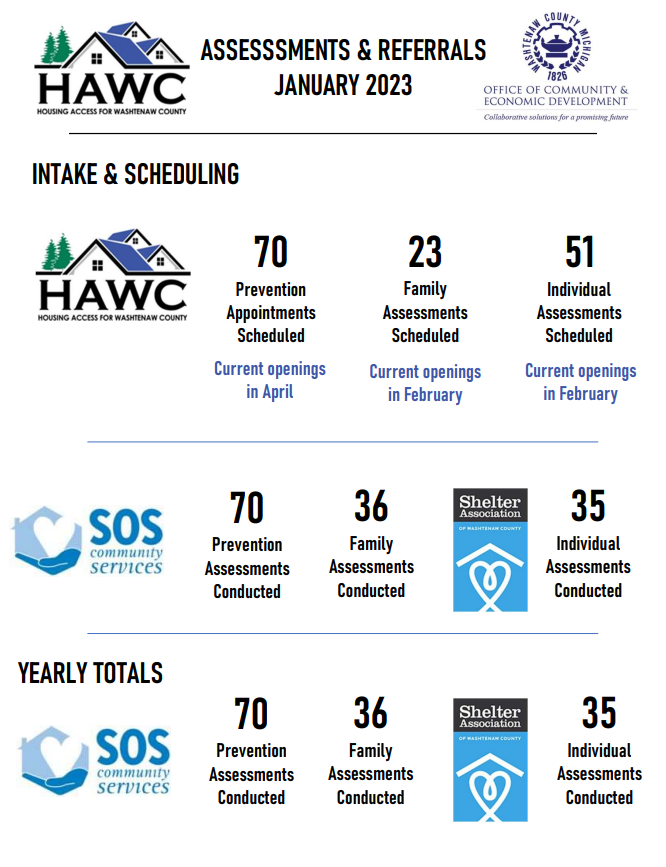 Below is the daytime warming shelter information for the 2023-2024 season. For more information, please visit bit.ly/washtenaw-warming. If you have any questions or would like more information, please call the Shelter Association of Washtenaw County Delonis Center at (734) 662-2829. If you are seeking overnight shelter, please contact Housing Access for Washtenaw County (HAWC) for a referral at (734) 961-1999. *Note: the Feb dates for First Baptist Church are February 5, 2024* through February 16, 2024. 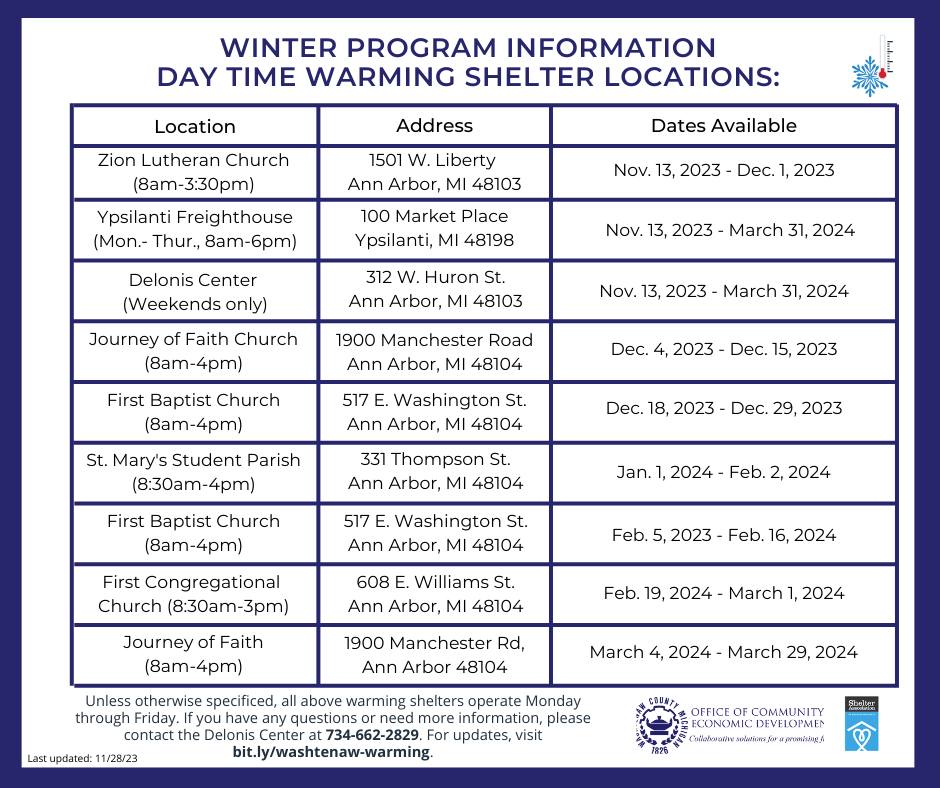 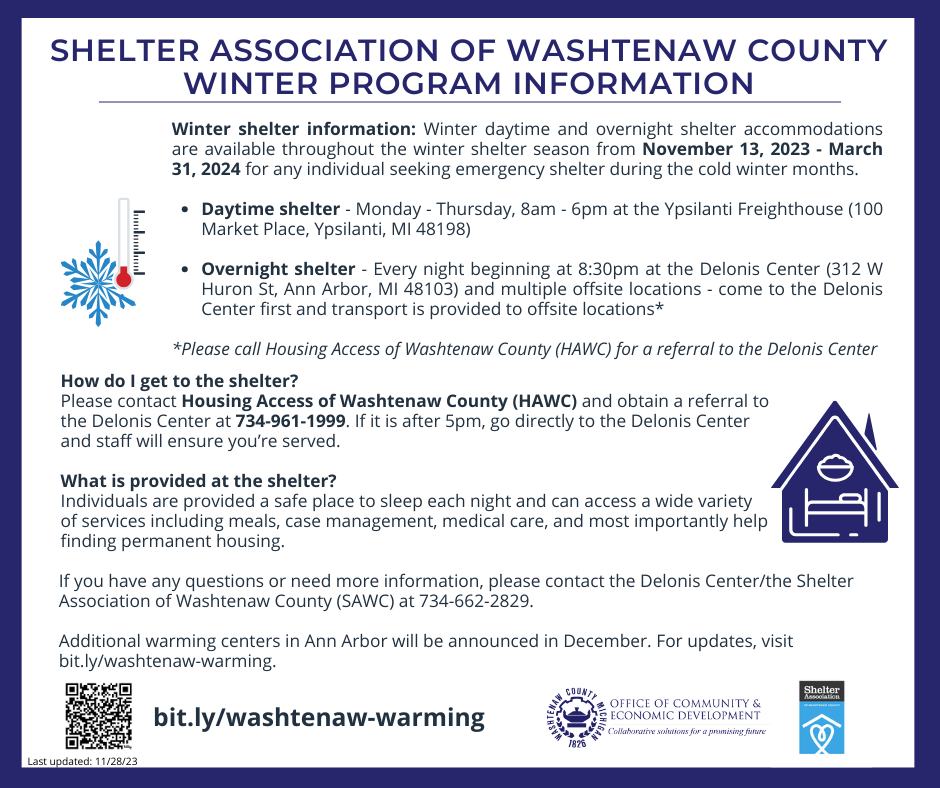 Below is an infographic for the month of November showing HAWC's Call Center Data such as the number of incoming calls per day, average wait time, reason for call, etc. To see HAWC's Call Center Data by the month you can click here. 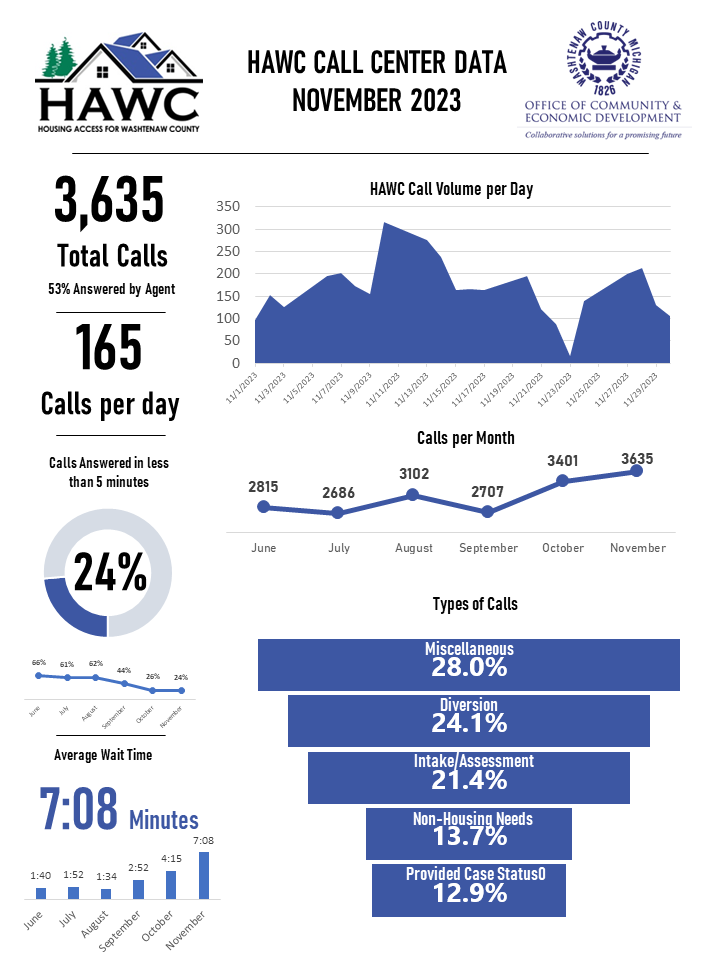 We understand, now, more than ever, that access to affordable housing and sheltering, particularly for families, have reached crisis levels in Washtenaw County. The Board of Commissioners regularly hears from residents and community partners advocating for funding and infrastructure to support residents experiencing housing instability and homelessness. On December 1, 2023, Washtenaw County will host a community conversation called “Housing Equity: Co-Creating a Vision for Housing Equity in Washtenaw County Centering the Voices of Lived Experience”. The event will take place at the Learning Resource Center (4135 Washtenaw Rd. Ann Arbor, MI 48108) from 9:00 am- 3:00 pm. The event is free and community members who would like to attend the event should register at this link: https://bit.ly/3Qvwmly. Breakfast and lunch will be provided. Registration will close when capacity is reached and space for those with lived experience will be prioritized. This convening is an opportunity for community members, officials, and service partners to center the voices of people in the county who have or are currently experiencing homelessness. 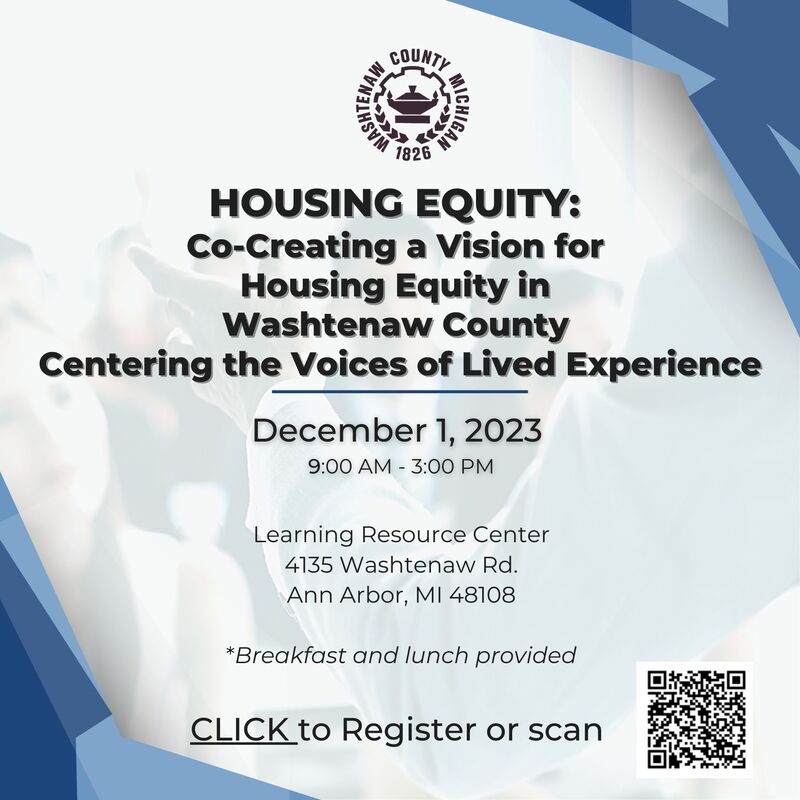 Below is an infographic for the month of October showing HAWC's Call Center Data such as the number of incoming calls per day, average wait time, reason for call, etc. To see HAWC's Call Center Data by the month you can click here. 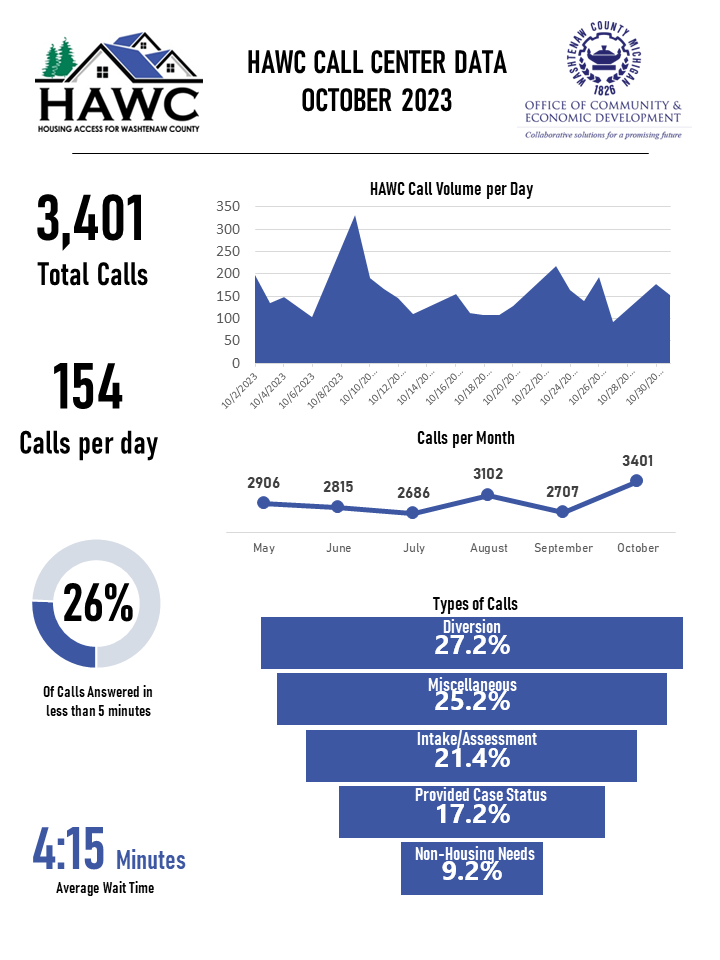 |
 RSS Feed