|
Below are three infographics for the month of May showing, first, HAWC's Call Center Data such as the number of incoming calls per day, length of call, reason for call, etc.; second, Assessments and Referrals for individuals and families contacting the Call Center for assistance; and third, Shelter and Permanent Housing statistics for the month (broken down into categories: Veterans, Families with Children, and Single Adults). To see HAWC's Call Center Data by the month you can click here.   
0 Comments
Below are three infographics for the month of April showing, first, HAWC's Call Center Data such as the number of incoming calls per day, length of call, reason for call, etc.; second, Assessments and Referrals for individuals and families contacting the Call Center for assistance; and third, Shelter and Permanent Housing statistics for the month (broken down into categories: Veterans, Families with Children, and Single Adults). To see HAWC's Call Center Data by the month you can click here. 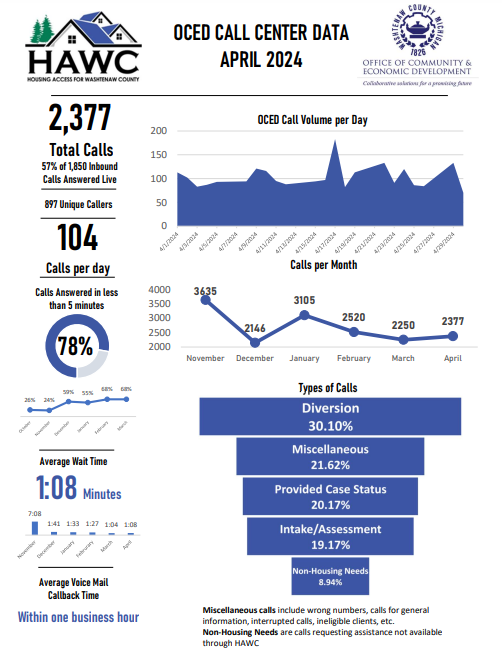 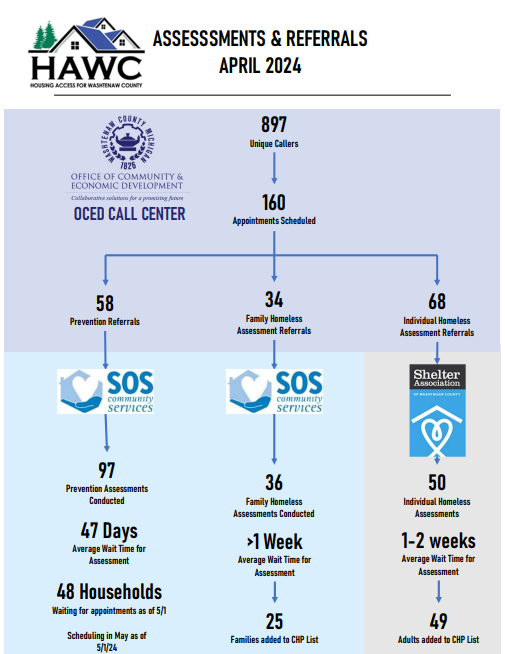 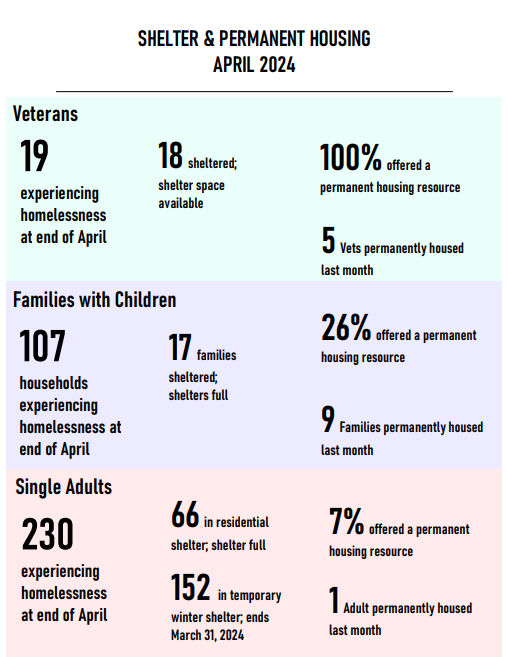 Below are three infographics for the month of March showing, first, HAWC's Call Center Data such as the number of incoming calls per day, length of call, reason for call, etc.; second, Assessments and Referrals for individuals and families contacting the Call Center for assistance; and third, Shelter and Permanent Housing statistics for the month (broken down into categories: Veterans, Families with Children, and Single Adults). To see HAWC's Call Center Data by the month you can click here. 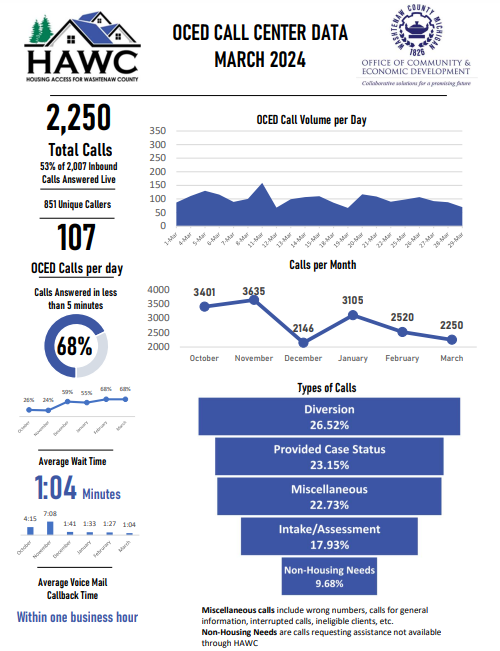 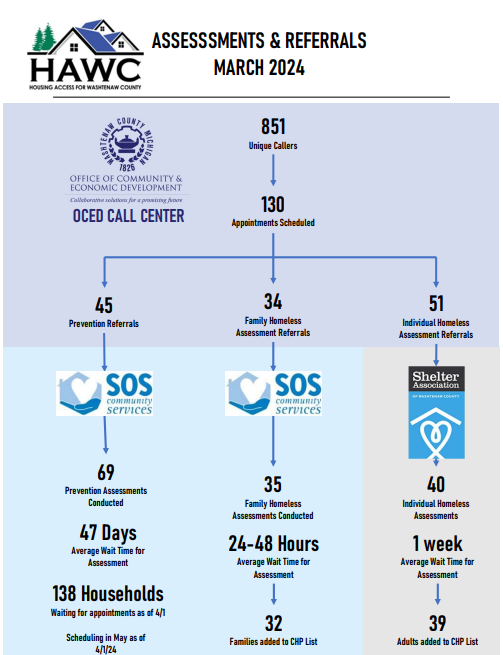 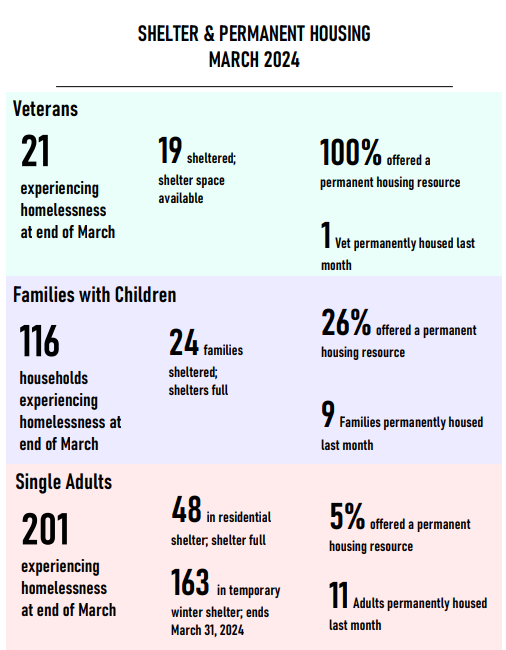 Below are three infographics for the month of February showing, first, HAWC's Call Center Data such as the number of incoming calls per day, length of call, reason for call, etc.; second, Assessments and Referrals for individuals and families contacting the Call Center for assistance; and third, Shelter and Permanent Housing statistics for the month (broken down into categories: Veterans, Families with Children, and Single Adults). To see HAWC's Call Center Data by the month you can click here. 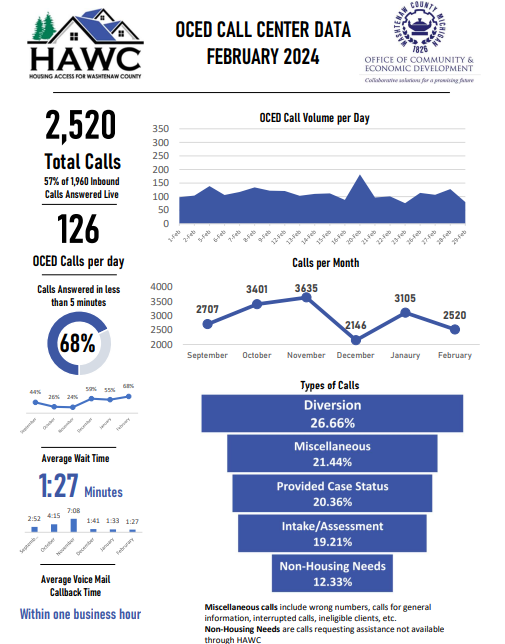 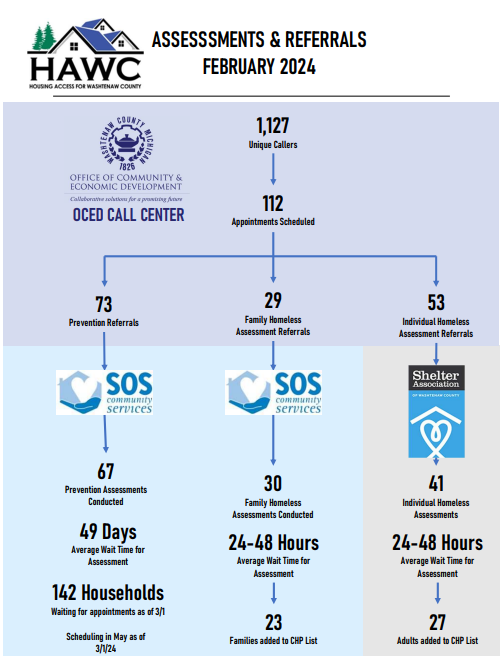 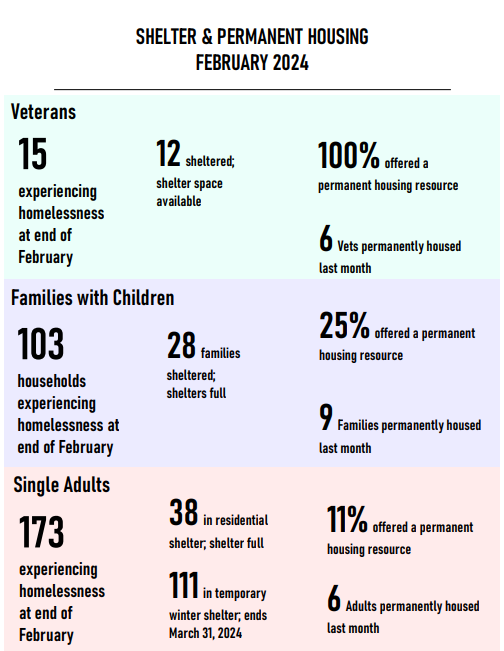 Below are two infographics for the month of January showing, first, HAWC's Call Center Data such as the number of incoming calls per day, length of call, reason for call, etc., and, second, Assessments and Referrals for individuals and families contacting the Call Center for assistance. [Please note the second image reflects data for January 2024 not January 2023.] To see HAWC's Call Center Data by the month you can click here. 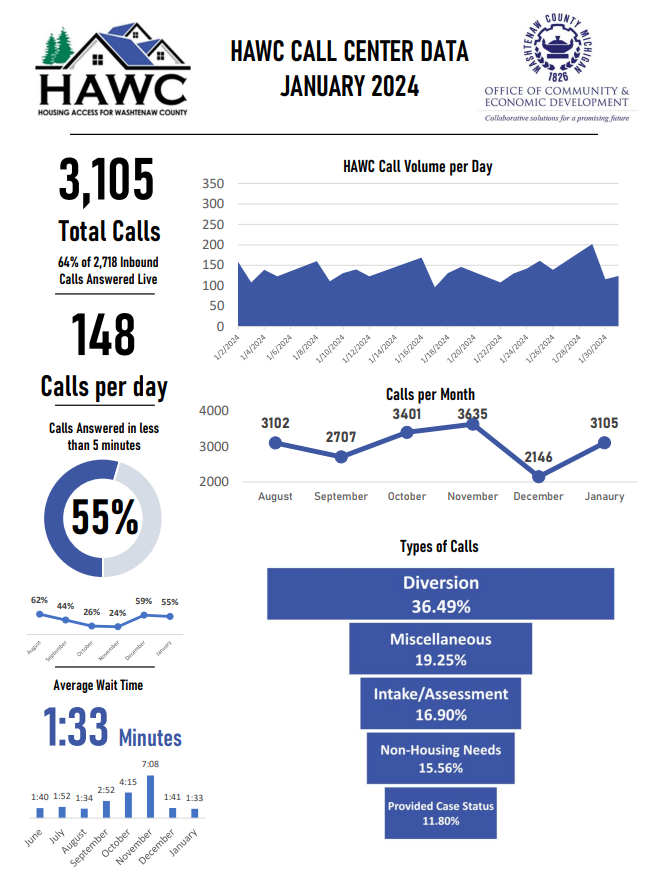 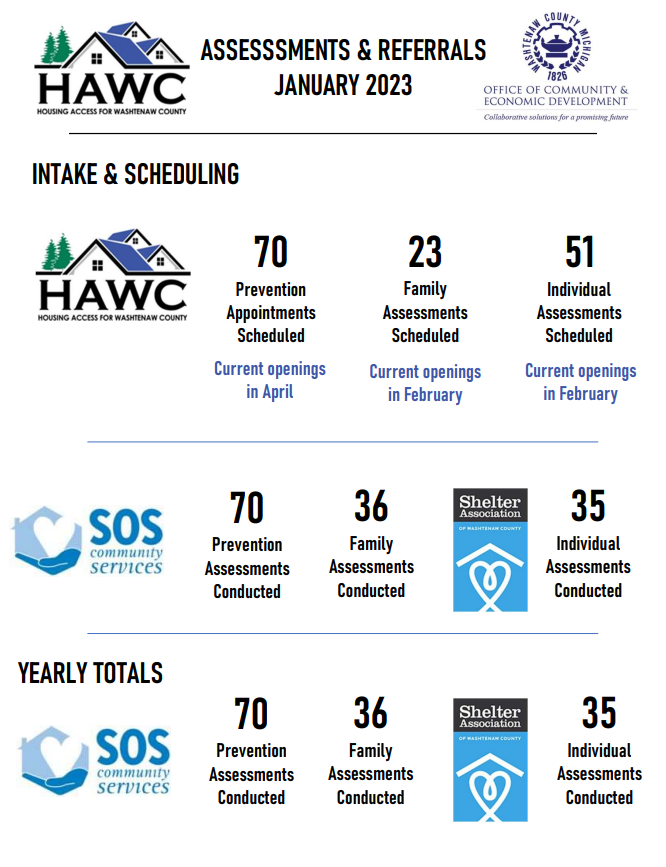 |
 RSS Feed